SANS Cloud Curriculum - 2024 Workshop Series
Aviata Solo Flight Challenge - Chapter 6
Making the Switch to Azure Monitor Agent
Welcome to Chapter 6 of the Aviata Cloud Solo Flight Challenge. In this chapter, you will learn the transition to Azure Monitor Agent, the key differences and how to utilse key technologies to scale logging deployment.
[[find email from MS related to end of life OMSfor Linux Agent.]]
Requirements
-
Personal Azure subscription with administrator access
- Need an Azure subscription? Create an Azure free account at https://azure.microsoft.com/en-us/free
- Choose Pay as you Go when setting up.
- If you have an Azure account already, you can use this but be aware you will be hosting a vulnerable web application created by the workshop code.
Setup Instructions
To complete the workshop, you need to build the Aviata cloud environment that includes a number of Azure resources used in the workshop. This process can take 15 minutes to complete. We strongly recommend you start this process before the workshop begins.
-
Open a new browser tab and sign into the Azure Portal. Press the Cloud Shell icon next to the search box.
No Storage Required
If prompted, select the "No Storage Account Required" option for opening this Cloud Shell.
OR
-
Using
Terminalopen anAzure Cloud Shellterminal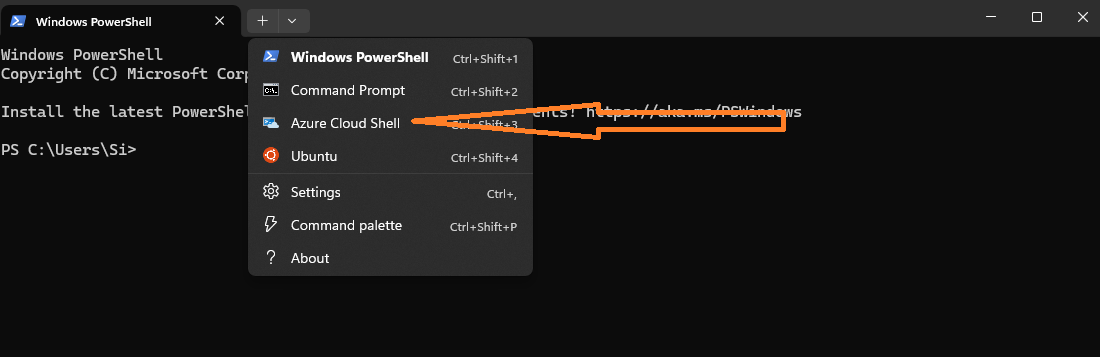
-
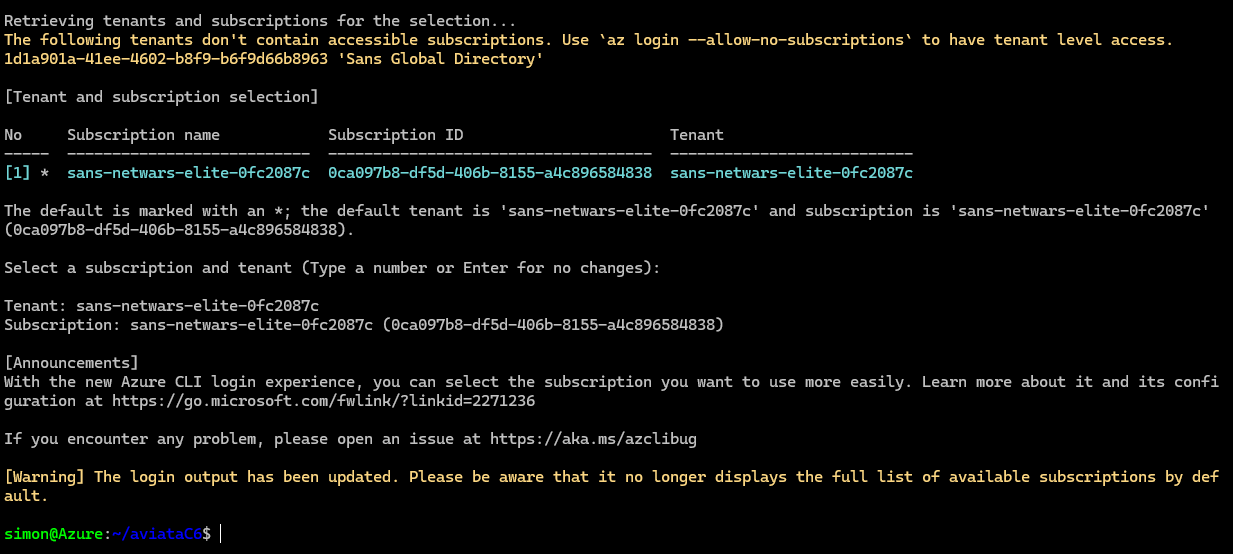
Verify you are logged in using the command:
az account list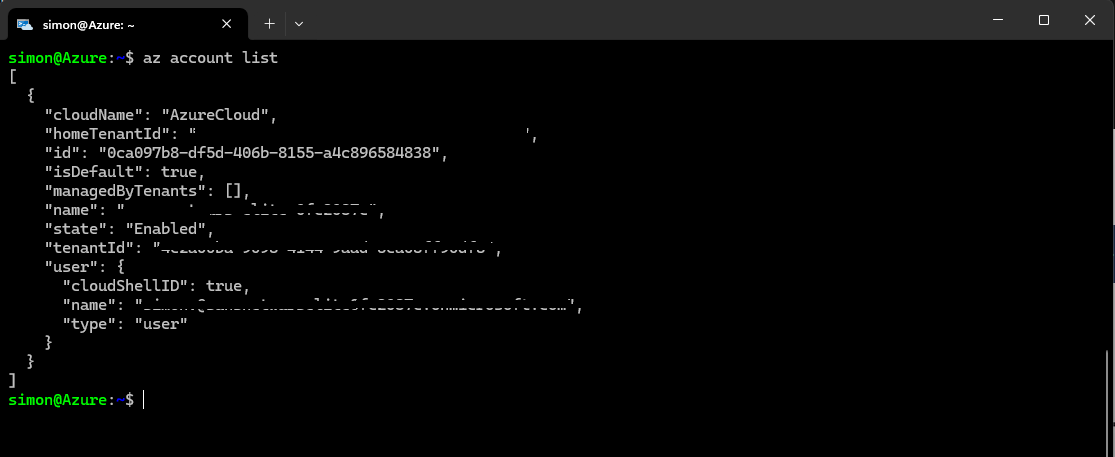
-
Create a local clone of the repository
git clone https://github.com/cy63rSANS/aviataC6 -
Navigate to the AviataC6 directory
cd aviataC6 -
Execute terraform init and terraform apply:
terraform init
terraform apply --auto-approve
if you receive the 'Error: building account' message:
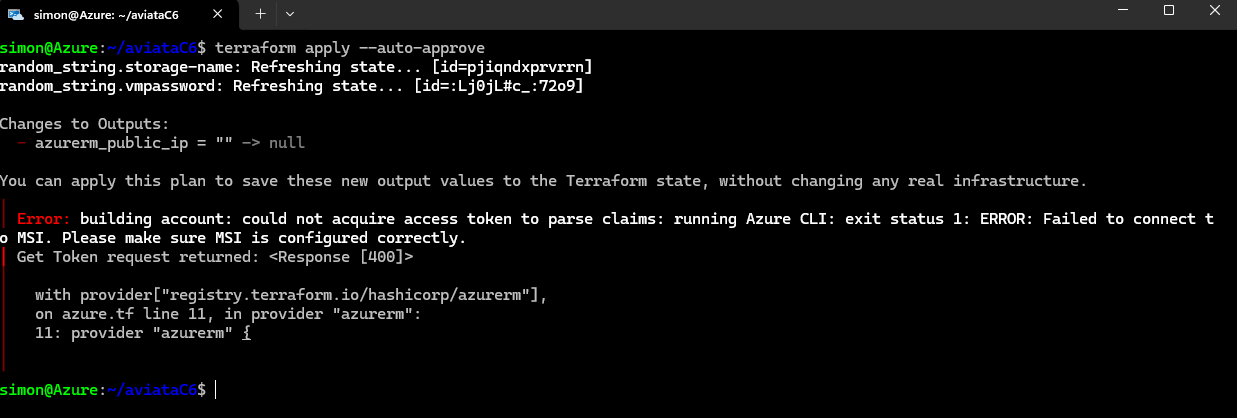
Run
az loginThen copy and paste the URL
https://microsoft.com/deviceloginto your browser, then enter the code presented:
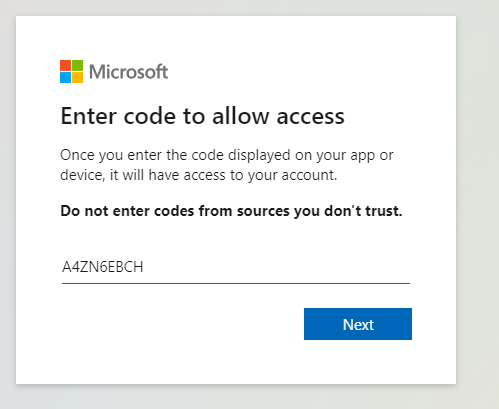
Select the correct account and approve CLI
You should get this response in the Terminal:
You can now re-execute
terraform apply --auto-approve -
Check out the new assets in the resource group "AviataCloud", click on the virtual machine called 'Webserver' and find its public IP address.
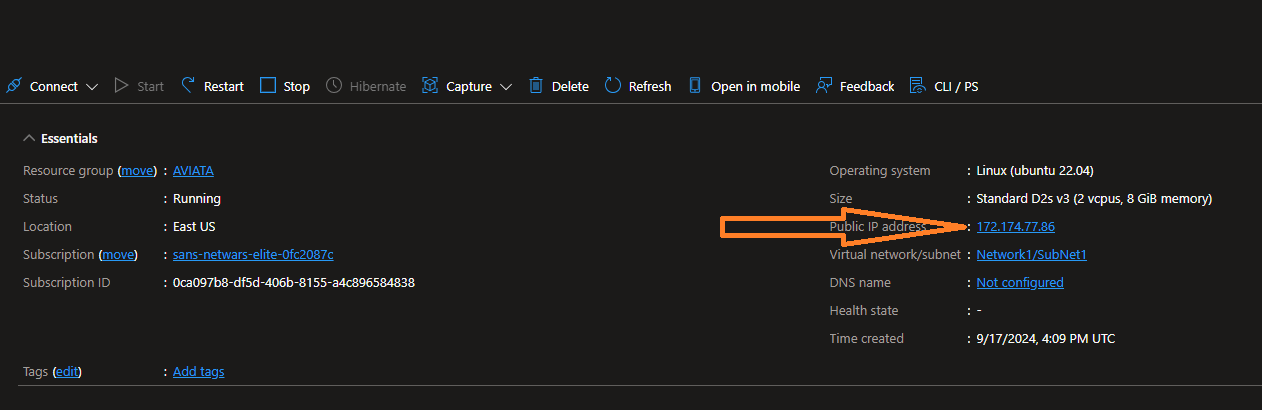
-
Browse to the Public IP, there should be a website on
http://<yourIP>:80and a log generator website athttp://<yourIP>:8080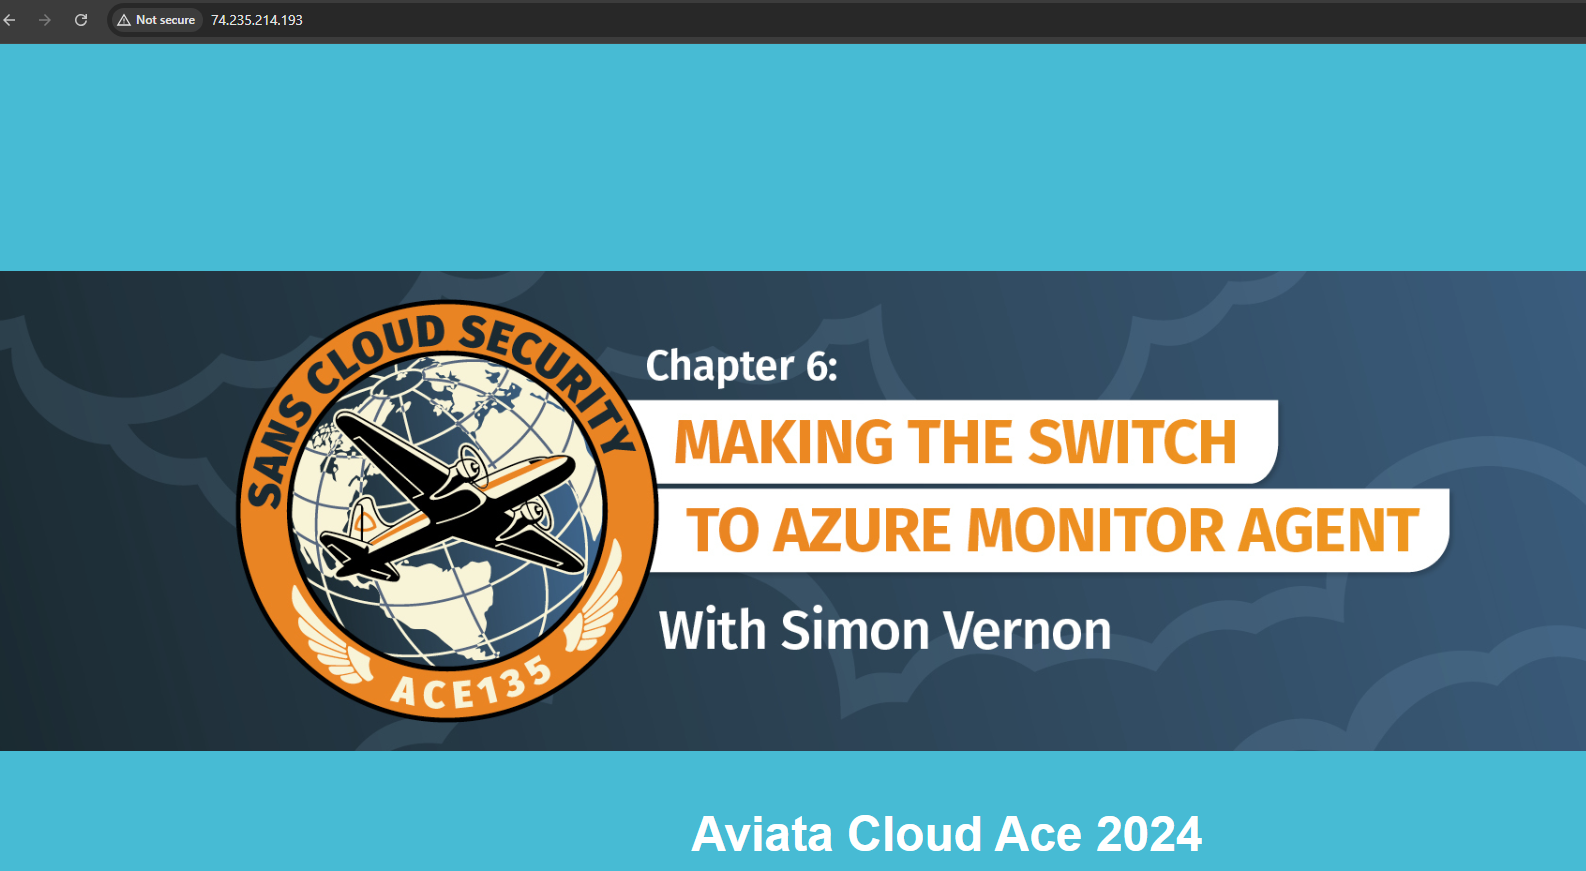
-
You are now ready to start the workshop
Challenge 1
- Navigate to Azure Portal and the resource group called AviataCloud
- In the search bar type
DCEfor Data Collection Endpoints -
Click on Create and complete the form by giving the DCE a name:
AviataC6-DCEand selecting the resource group AviataCloud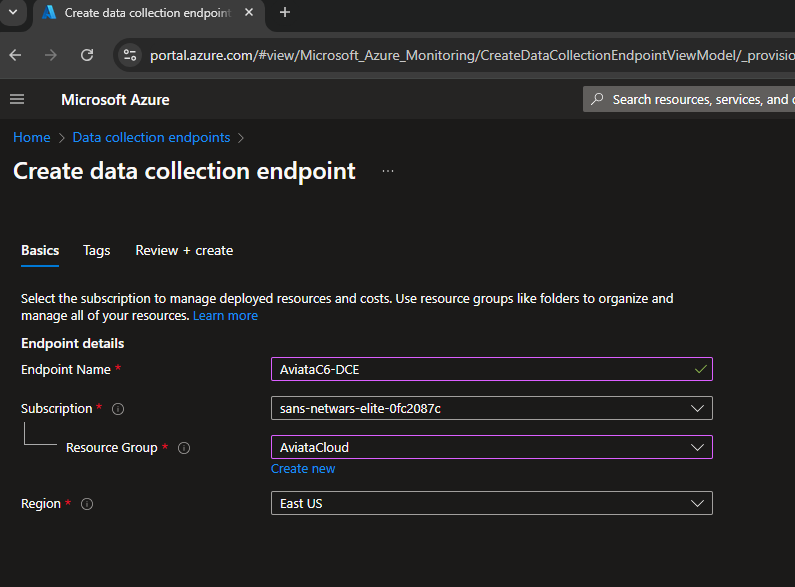
-
Click on Review and Create then Create
- You should now have a Data Collection Endpoint in the resource group AviataCloud.
- Next we're going to create Data Collection Rules for standard logs
- In the Azure seach bar type
DCRand select Data Collection Rules then click on Create -
On the Create Data Collection Rule page:
- Enter the rule name:
LinuxSyslog - Select your current subscription
- Select the resource group: AviataCloud
- Select the region as East US
- Select the Platform type: Linux
- Select the Data Collection Endpoint: AviataC6-DCE
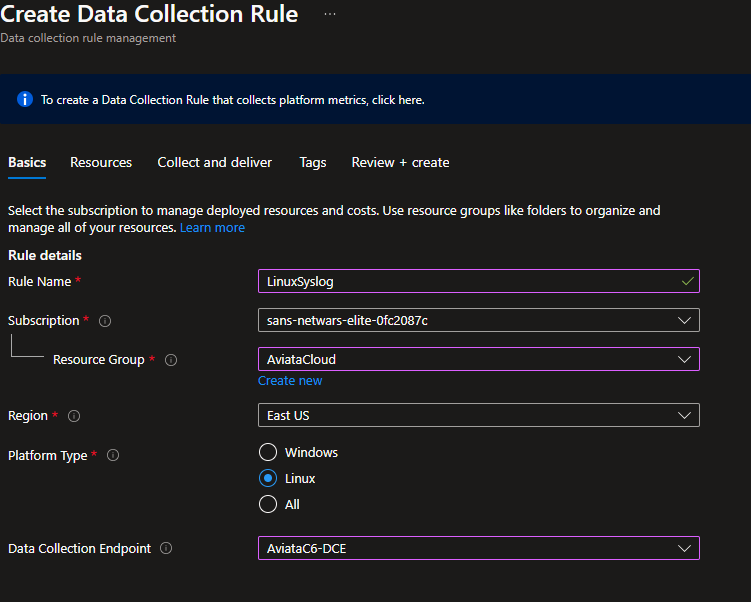
- Enter the rule name:
-
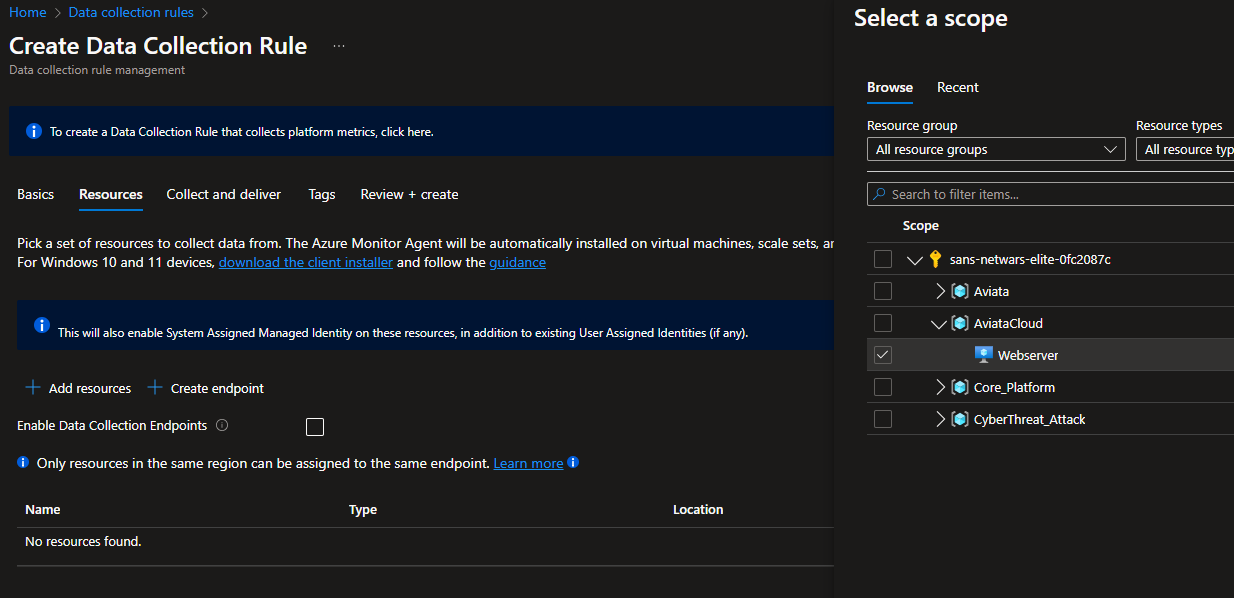
Click on Next then click Add resources, Select the tick box next to the AviataCloud Webserver and hit Apply
-
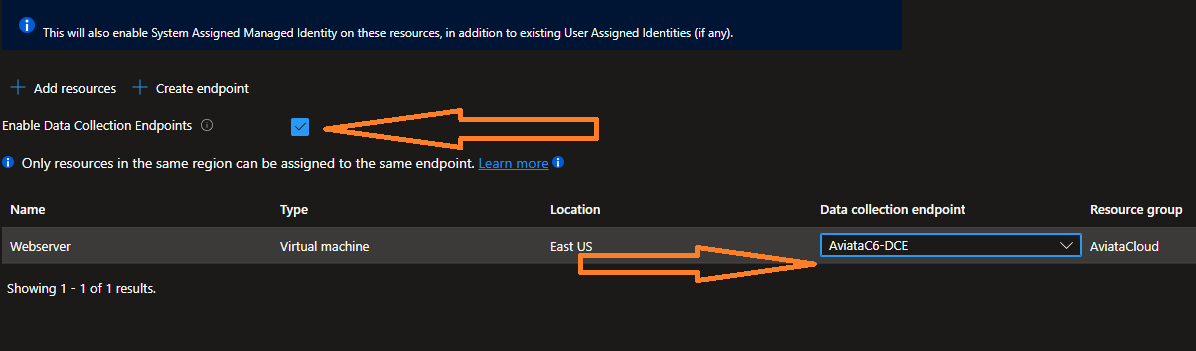
Click the box next to Enable Data Collection Endpoints and then select the AviataC6-DCE Endpoint
-
Click on Next : Collect and Deliver
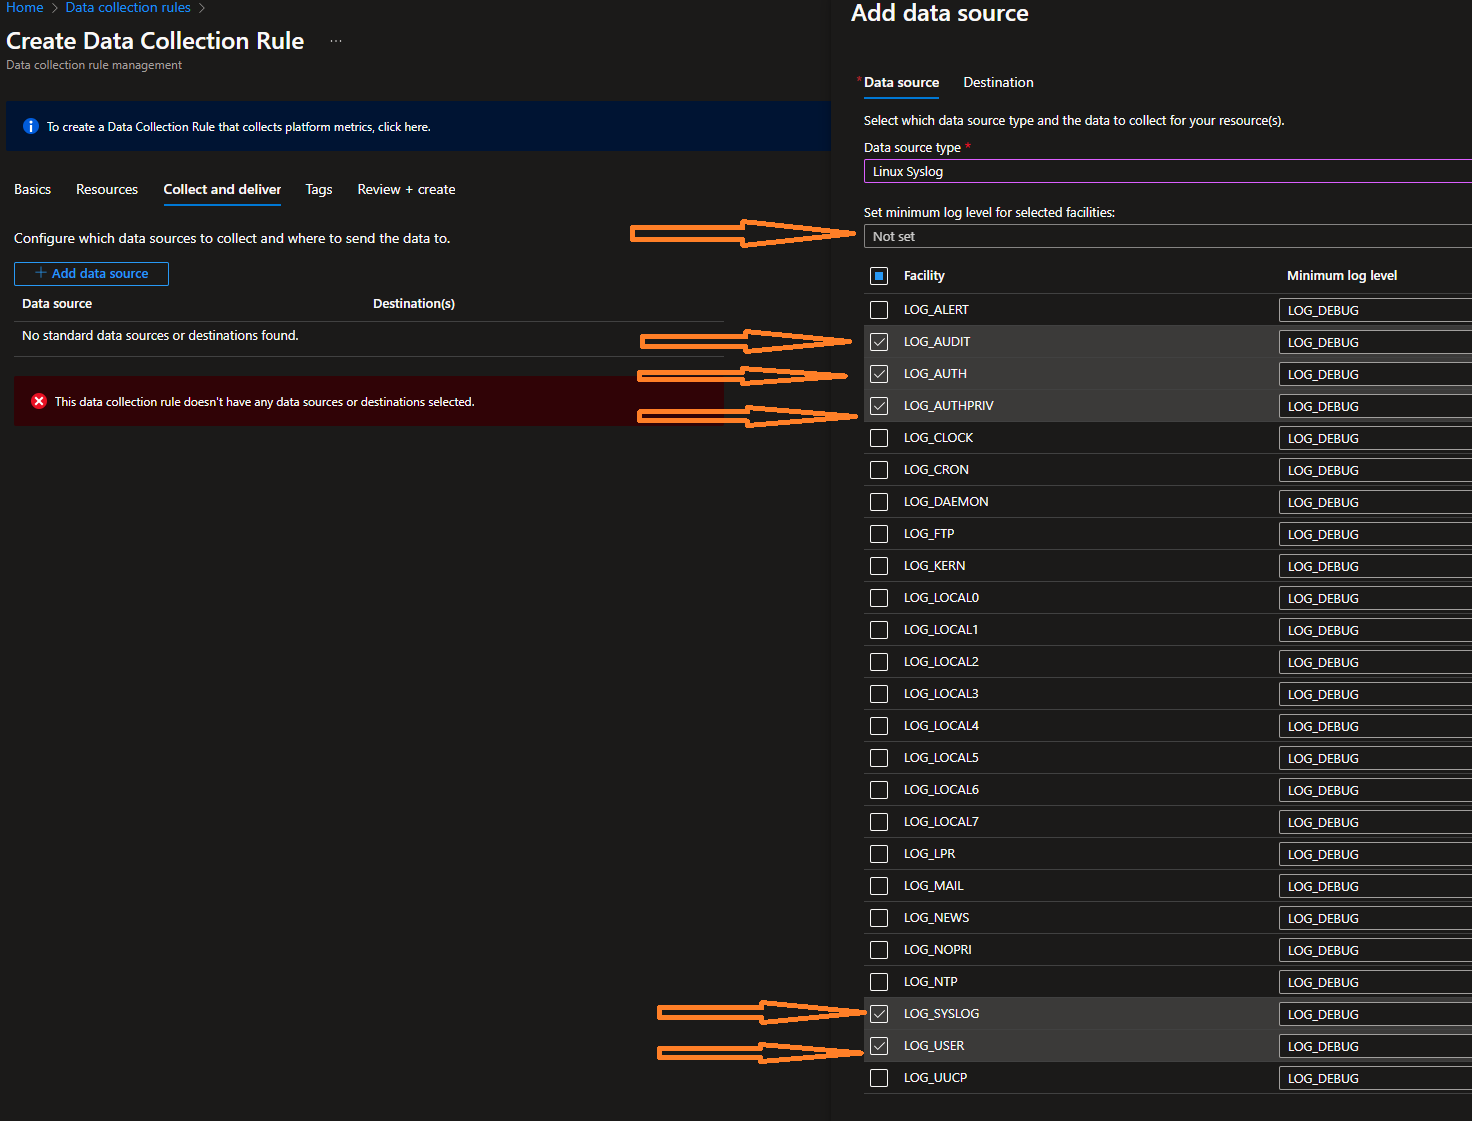
- Click Add Data Source
- Select Linux Syslog from the Data source type dropdown list
- Select the logging level you would like for the rule. (For the demo I'm using LOG_DEBUG for all selections)
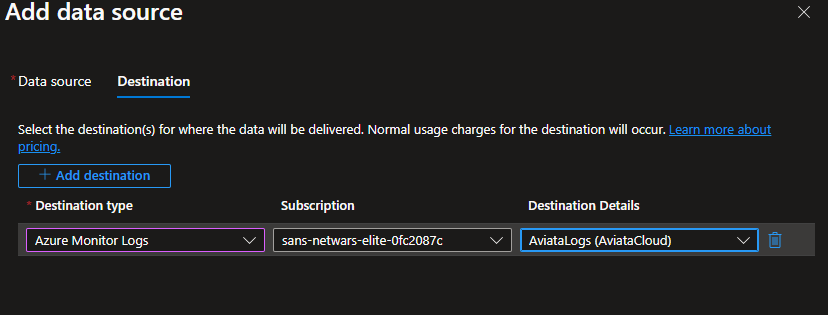
- Select Next : Destination, then Add destination and from the dropdowns select Azure Monitor Logs and AviataLogs(AviataCloud)
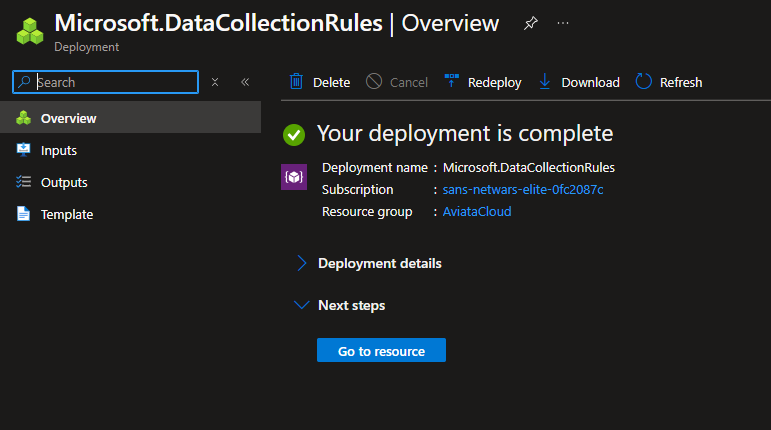
- Click Add data source then Review + Create.
- A final validation will occur before you can finally hit create
-
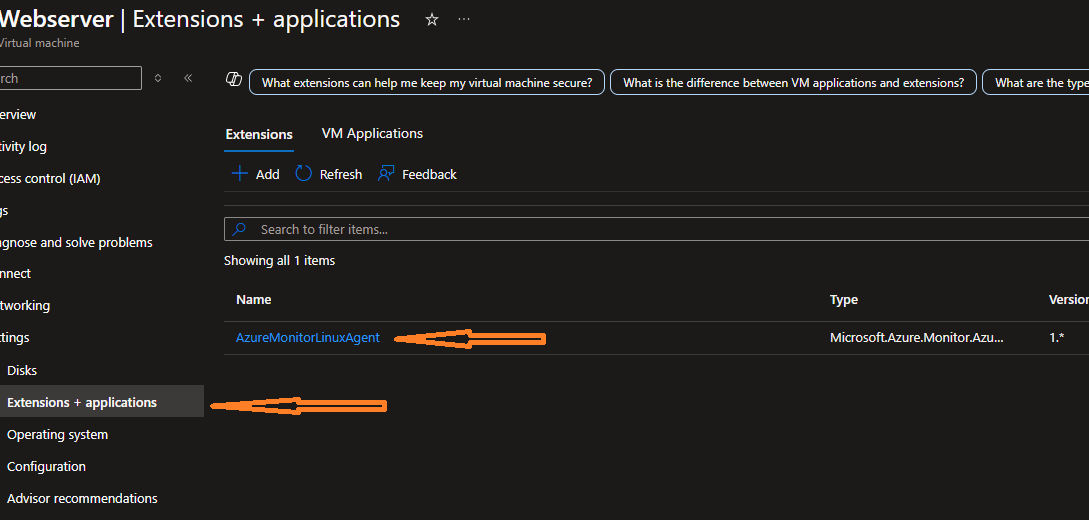
To confirm this has completed successfully you can verify the Agent has been installed. Simply navigate back to the resoource group AviataCloud, then the virtual machine Webserver and click on Settings then Extensions and applications. You should see this:
-
It will take around 10 minutes to show any logs, you can go to log analytics workspace AviataLogs and run the following query to see the data:
Syslog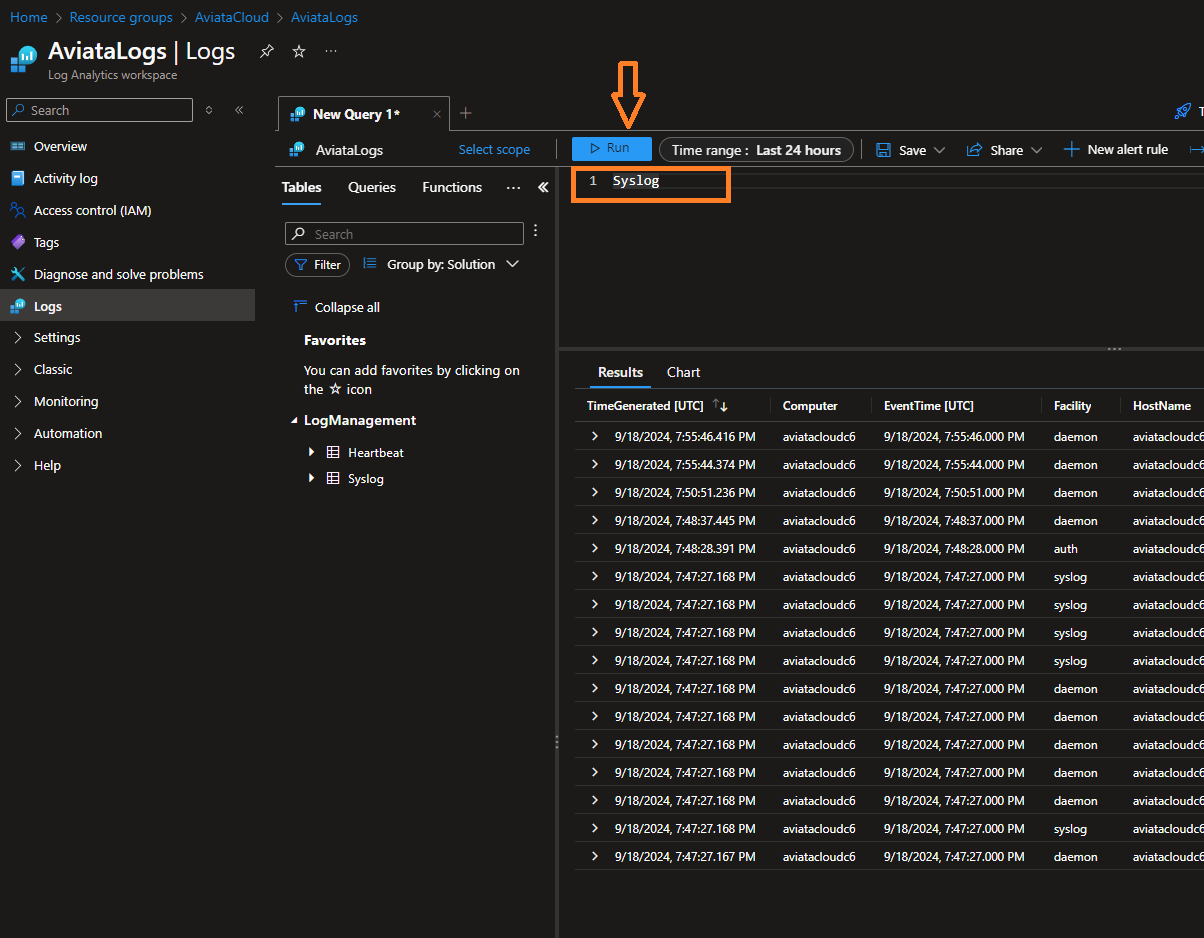
Challenge 2
The first step is to import our log table structures into Log Analytics tables. Follow this procedure:
-
Open a new browser tab and sign into the Azure Portal. Press the Cloud Shell icon next to the search box.
OR
-
Using Terminal open an 'Azure Cloud Shell' terminal
-
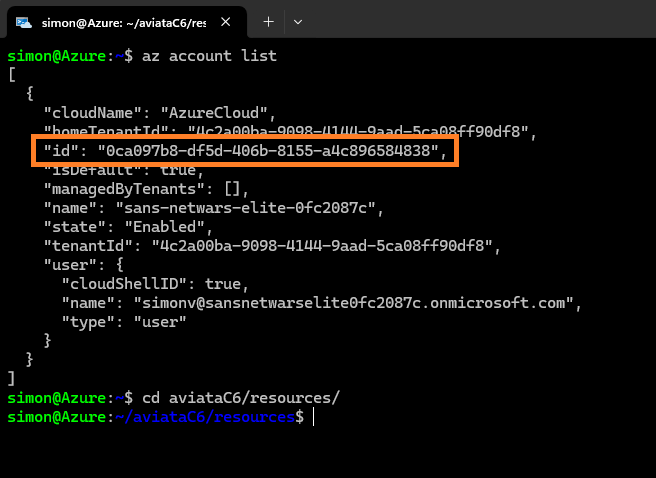
Verify you are logged in using the command and discover your Subscription ID (refereced as "id")
az account list
-
Navigate to the aviataC6/resources
cd aviataC6/resources/ -
Now you have to edit the 2 .ps1 files to change the subscription value. Use nano or your prefered editor.
nano ApacheErrorLogTable.ps1 -
Add your subscription ID and then use
CTRL+XandYthen ENTER to save the changes.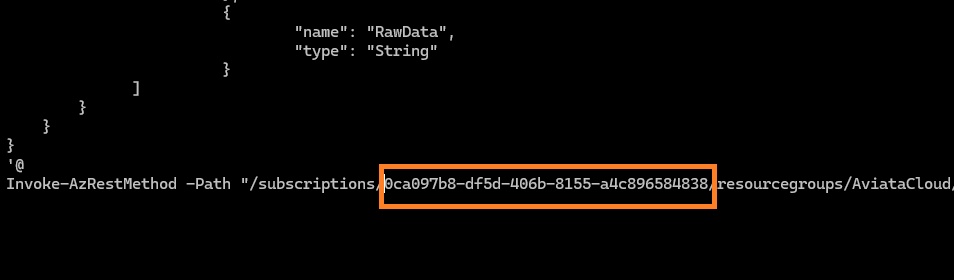
-
Do the same for ApacheAccessLogTable.ps1
-
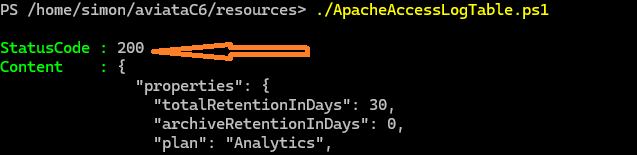
Now execute the Powershell scripts (we have to switch to powershell first - use pwsh to switch contexts)
pwsh ./ApacheErrorLogTable.ps1 ./ApacheAccessLogTable.ps1 bash -
Your lookiing for the StatusCode : 200 response to confirm the task completed.
-
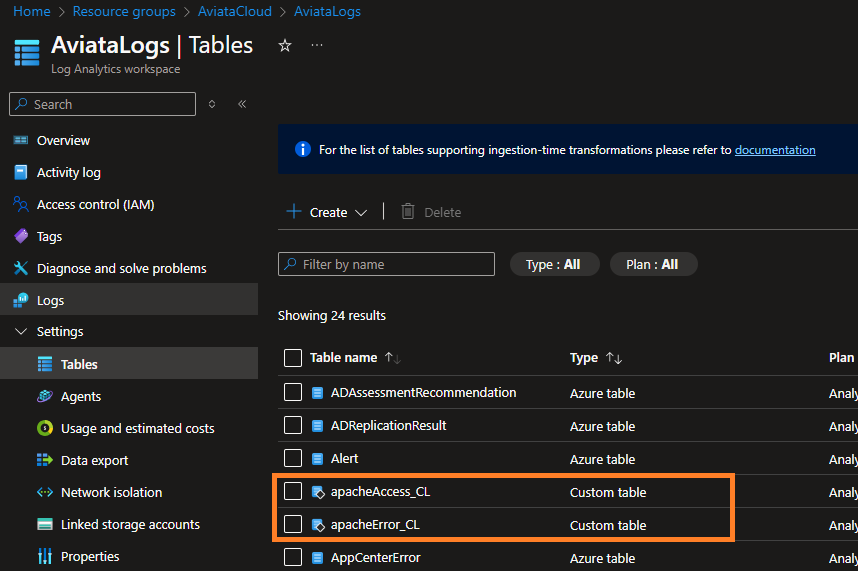
You can now navigate inside the Azure portal to Log Analytics, AviataLogs and then Settings and tables and you should see 2 custom tables called apacheAccess_CL and apacheError_CL.
-
Now we follow the a similar procedure as Challenege 1, to create the Data Collection Rule.
-
In the Azure seach bar type
DCRand select Data Collection Rules then click on Create -
On the Create Data Collection Rule page:
- Enter the rule name:
ApacheAccess - Select your current subscription
- Select the resource group: AviataCloud
- Select the region as East US
- Select the Platform type: Linux
- Select the Data Collection Endpoint: AviataC6-DCE
- Enter the rule name:
-
Click on Next then click Add resources, Select the tick box next to the AviataCloud Webserver and hit Apply
-
Click the box next to Enable Data Collection Endpoints and then select the AviataC6-DCE Endpoint
-
Click on Next : Collect and Deliver
- Click Add Data Source
- Select Custom Text Logs from the Data source type dropdown list
- in File pattern enter:
/var/log/apache2/access.log←the path to the log file on the sevrer - in table name enter:
apacheAccess_CL← the table we just created - Record delimiter can be left default
- Transform should be:
source | extend d=split(RawData," ") | project Src_IP=tostring(d[0]),TimeGenerated=todatetime(strcat(d[3]," ",d[4])),Method=tostring(d[5]),Request=tostring(d[6]),Response=tostring(d[8]),Size=toint(d[9]),Referrer=tostring(d[10]),UserAgent=tostring(d[11]), RawData← This is the KQL transform for the Access log. This is available in the /aviataC6/resource/KQLtransform.kql file
- Select Next : Destination, then Add destination and from the dropdowns select Azure Monitor Logs and AviataLogs(AviataCloud)
- Click Add data source then Review + Create.
- A final validation will occur before you can finally hit create
-
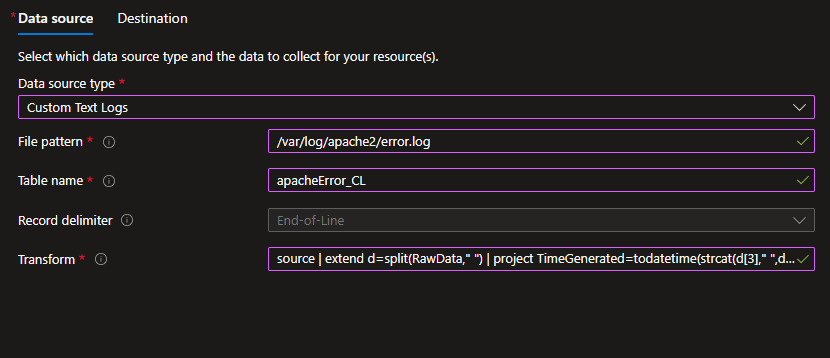
Now we have to do the same procedure agian but for the Apache Error.log with the following substitutes:
- Call the rule
ApacheError - In Collect and Deliver add the file patterm
/var/log/apache2/error.log - In table name enter:
apacheError_CL - Transform should be:
source | extend d=split(RawData," ") | project TimeGenerated=todatetime(strcat(d[3]," ",d[4])),Source=tostring(d[5]),Process=tostring(d[6]),ErrorMSG=tostring(d[7]), RawData← This is the KQL transform for the Error log. This is available in the /aviataC6/resource/KQLtransform.kql file - Everything else is identical to the previous procedure.
- Call the rule
-
Wait 10 minutes and we should start to see some results in the Log Analytics console.
-
The website based on the IP address assigned to your VM is actually 2 websites. The first is on port 80 and the 2nd is on port 8080. To generate some data we can browse to the port 80 verison and enter some invaid URLs. This will create some logs in the ApacheAccess_CL table.
-
To create logs in Syslog and the apache error log use the Log Generator on the the port 8080 webserver.
Challenge 3
-
KQL intro..
-
lets start simple
-
Syslog← outputs all the logs from syslog from all VM's connected to Data Collection Rules that output to this Log Analytics workspace. -
apacheAccess_CL← outputs all the logs from Apache Access from all VM's connected to Data Collection Rules that output to this Log Analytics workspace. -
apacheError_CL← outputs all the logs from Apache Error from all VM's connected to Data Collection Rules that output to this Log Analytics workspace. -
To determine via machine name what logs are being recorded:
Heartbeat
| where TimeGenerated > ago(24h)
| where Computer has "Webserver"
| project TimeGenerated, Category, Version
| order by TimeGenerated desc
- Lets be more specific, now looking for failed password attempts against the SSH service
Syslog
| where ProcessName == "sshd"
| where SyslogMessage contains "Failed password"
| project TimeGenerated, HostName, ProcessName, SyslogMessage
| order by TimeGenerated desc
- Lets dive deeper into the IP addresses that are attempting access:
Syslog
| where ProcessName == "sshd" // SSH daemon process
| where SyslogMessage contains "Failed password" // Unsuccessful login attempt
| extend IPAddress = extract("([0-9]{1,3}\\.[0-9]{1,3}\\.[0-9]{1,3}\\.[0-9]{1,3})", 0, SyslogMessage) // Extract IP address
| project TimeGenerated, HostName, IPAddress, SyslogMessage
| summarize Count = count() by IPAddress, HostName
| order by Count desc
- Maybe a SSH key type downgrade attack?
Syslog
| where ProcessName == "sshd" // SSH daemon process
| where SyslogMessage contains "SSH" // SSH protocol messages
| where SyslogMessage contains "no matching key exchange"
| project TimeGenerated, HostName, SyslogMessage
| order by TimeGenerated desc
- Brute force login attempts:
Syslog
| where ProcessName == "sshd"
| where SyslogMessage contains "Failed password"
| summarize FailedAttempts = count() by User, IPAddress = extract("([0-9]{1,3}\\.[0-9]{1,3}\\.[0-9]{1,3}\\.[0-9]{1,3})", 0, SyslogMessage), bin(TimeGenerated, 1h)
| where FailedAttempts > 5 // Adjust threshold based on environment
| order by FailedAttempts desc
- Suspicious binaries executing from temporary directories:
Syslog
| where SyslogMessage contains "/tmp/" or SyslogMessage contains "/var/tmp/"
| where SyslogMessage contains "exec" // Detect execution messages
| project TimeGenerated, HostName, ProcessName, SyslogMessage
| order by TimeGenerated desc
- Unauthorised sudo commands:
Syslog
| where SyslogMessage contains "sudo" // Detect sudo usage
| project TimeGenerated, HostName, User, SyslogMessage
| order by TimeGenerated desc
Challenge 4
-
To destroy everything in the lab complete the following commands in the cloud shell
-
Open a new browser tab and sign into the Azure Portal. Press the Cloud Shell icon next to the search box.
OR
-
Using Terminal open an 'Azure Cloud Shell' terminal
-
Delete the Resource Group containing the workshop resources
az group delete --name AviataCloud -
To also cancel the subscription, navigate to Subscriptions in the Azure portal, then select the subscription and click on Cancel Subscription then follow the instructions.